
Be sure to check out the entire Third Quarter Market Watch report here for an in-depth look at the strength of our markets.
2018 has been an unusual year for our housing markets to be sure. We began the year with every market we serve experiencing modest decreases in either unit sales or dollar volume, or both, versus the first quarter of 2017, a phenomenon we had not witnessed in several years. At that time we attributed this pause in the marketplace to uncertainty surrounding the tax reform bill that passed in late 2017. Then, in the second quarter the story began to change: certain areas started to catch up to or even exceed the first half of 2017, while others remained behind. The third quarter found us trending even further in a positive direction. Westchester remains slightly behind 2017 as Fairfield County appears to be closing the gap, even as the Shoreline along with Litchfield and Berkshire Counties climbed ahead of the prior year, and the Farmington Valley stood nearly flat.
The first two quarters of 2018 saw sales county-wide slipping just behind the same two periods of 2017 by 5-6% in unit sales and 3-4% in dollar volume—contrary to media reports in outlets such as Bloomberg and The Wall Street Journal that misstated the data, spreading confusion among consumers with claims that declines in unit sales were as high as 18% in the second quarter. (A detailed analysis of this issue is provided on williampitt.com/blog, Part 1 and Part 2.) The third quarter was more of the same, with unit sales and dollar volume declining compared to the same time last year by 4%. Year to date, unit sales were 5% behind the first three quarters of 2017, while dollar volume was behind by 3%. Overall the market remains a little down, but a deeper dive into specific price ranges and towns reveals some interesting findings.
The articles drew the conclusion that the tax bill was responsible for the steep declines. Our own position on the tax bill question is that we feel it’s too early to know its full effect, and we will likely have to wait until the end of this year or early next to evaluate all the ramifications. Whatever effect it may have, the current strength of the economy supports a healthy outlook for real estate.

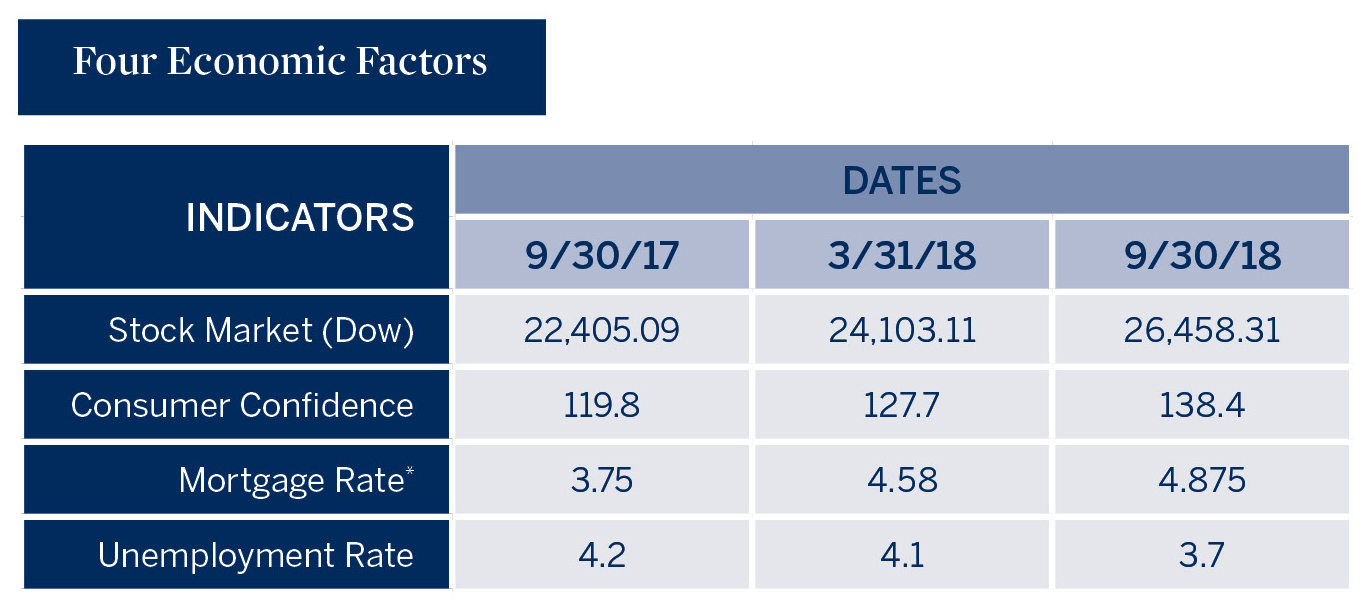
Historically, the key leverage point in determining the health of the real estate market is consumer confidence. This, in turn, is largely driven by several important economic factors, which include interest rates, the stock market, unemployment and the GDP.

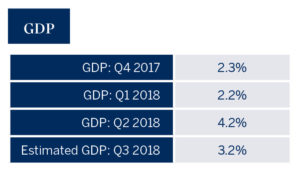
Interest rates have inched up but remain at historic lows, unemployment just hit its lowest rate in nearly half a century, and the stock market, while certainly fluctuating at times, still stands at incredible heights. The GDP increased by 4.2% in the second quarter, its fastest growth rate in four years, and is projected to come in anywhere from 3.2 to 3.8% for the third quarter, a slower but still strong pace. These positive factors perfectly correlate with soaring levels of consumer confidence.

The Conference Board Consumer Confidence Index has reported consistently elevated consumer confidence levels this year, reaching nearly an 18-year high of 138.4 (1985=100) in September. When consumer confidence is this healthy, we typically see demand in the real estate buyer pool follow suit. We believe these macro U.S. data points apply to our local housing markets just as they do nationally.
In Westchester County overall, unit sales and dollar volume declined in the third quarter compared to the same time last year by 4%. Year to date, unit sales were 5% behind the first three quarters of 2017, while dollar volume was behind by 3%. In Southern Westchester, unit sales for the third quarter were 3% behind and dollar volume 2% behind the same period last year. Year to date, unit sales were lower by 3% compared to the first three quarters of 2017, but dollar volume for the first time this year was ahead by 3%. In Northern Westchester, unit sales and dollar volume for the third quarter both decreased by 8% compared to the same time in 2017, while year to date, unit sales decreased by 7% and volume by 3% versus the first three quarters last year.
In Fairfield County, each quarter this year has found the region just a little behind the same quarter of 2017, and that continued in the third quarter, although this quarter’s declines were the most marginal of the year so far. Quarter over quarter, unit sales county-wide were 3% lower while dollar volume was 1% higher than the same period last year. Year to date, unit sales and dollar volume were both 3% behind the first three quarters of 2017. These figures are closer to 2017 figures than we saw last quarter, suggesting the county is making headway and beginning to catch up to last year.
The Connecticut Shoreline, encompassing New Haven, Middlesex and New London counties, is now definitively witnessing a stronger back half of 2018 after a slower start early in the year. For the third quarter, the region saw unit sales standing nearly even with the same time last year at a 1% decrease, while dollar volume jumped ahead by 9%. Year to date, units are also close to even with the first three quarters of 2017, only behind by 1%, while volume, again, is ahead by 6%.
Litchfield County started picking up steam last quarter after a slower early part of the year, and is now climbing ahead of the prior year. For the third quarter, unit sales and dollar volume county-wide both stood ahead of the same period last year by 8%, while year to date, unit sales increased by 5% and dollar volume by 4% compared to the first three quarters of 2017.
Over in the Farmington Valley region of Hartford County, comprising Avon, Canton, Farmington, Granby and Simsbury, plus the key additional communities we serve including Burlington, Hartland and West Hartford, the market pulled back slightly compared to the same period last year, though it’s close to flat year to date. Unit sales for the quarter dipped by 4% and dollar volume by 7% versus the third quarter of 2017, while year to date, unit sales and dollar volume are each behind the first three quarter of 2017 by a slight 2%.
In the Berkshires, the third quarter found the region solidly ahead of 2017. For the quarter, unit sales increased by 11% and dollar volume by 16% compared to the same period last year, while year to date, units increased by 2% and dollar volume by 8% versus the first three quarters last year. Unlike the second quarter, which turned in different results for the north, central and south counties, this quarter the county experienced sales growth across the board.
I hope you find this report informative on what’s happening in your market, and invite you to contact one of our sales associates if we can help you with any of your own real estate needs.

Paul E. Breunich
President and Chief Executive Officer
William Pitt • Julia B. Fee Sotheby’s International Realty
